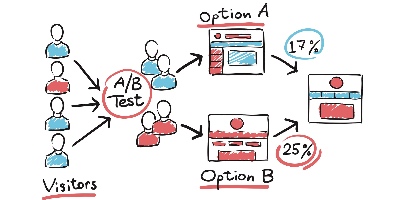
A/B Testing Summary:
In an A/B test, a change is applied to a treatment group, and its performance is compared against a control group to estimate the impact of the change.
STEP 1: SELECT A PERFORMANCE METRIC
It’s important to understand the metric used to evaluate the results of the test. Whether the goal is to increase sales, profit, conversion rate, etc., this should be specified at the upfront.
Click here to learn more about metrics in A/B testing.
STEP 2: SELECT THE EXPERIMENT DESIGN
Matched pair – when the sample size is small and/or the data is difficult to collect, a matched pair experiment should be used.
Randomized design – when the sample size is large and the data is easy to collect, then a randomized experiment should be used. Randomized experiments are very common for web-based AB tests.
STEP 3: SELECT TREATMENT AND CONTROL UNITS
Each individual in the test is considered a unit of diversion. The unit of diversion can be a person, store, etc. In a test, units are split into two groups, the treatment group and control group. Treatment and control units are compared against each other.
Click here to learn more about unit of diversion in A/B testing.
STEP 4: SELECT EXPERIMENTAL AND CONTROL VARIABLES
Experimental Variable – The experimental, or treatment, variables are the variables that is different between treatment and control units. For example, if you are testing a new price point, the experimental variable would be price.
Control Variable – The control variables are the variables that should remain constant between test and control groups. These variables ensure that the treatment and control groups are representative of each other and that the results will apply to the population. Control variables are used to match each treatment unit to one or more control units.
STEP 5: DETERMINE TEST DURATION AND SAMPLE SIZE
These two go hand in hand and contribute most directly to statistical significance. You can improve statistical significance by either increasing the sample size or test duration. Generally the duration of a test should be at least as long enough to capture a representative sample.
Click here to learn more about how to calculate sample size.
STEP 6: RUN THE TEST AND PREPARE THE DATA
Now it’s time to run the test and collect the data. Preparing the data includes filtering for the dates of the test, ensuring there are no duplicate records, removing records with incomplete data, and removing outliers.
STEP 7: ANALYZE RESULTS
Lift – Compare the average performance between the two groups. It can also be useful to understand the distribution of the performance of the units.
Statistical Significance – Performing a t-test provides a p-value. P-values below 0.05, indicate statistically significant results. Paired t-test are used for matched pair experiments and unpaired t-test for randomized experiments.
Impact Estimation – In order to provide an expected impact of broad implementation of the treatment, apply the lift calculation to the entire population.
